First run the main notebook
%%capture
%run ./Image_processing_concepts_pt2.ipynb
Scatter of size vs. ratio
# Investigate relationships in data
nuclear_sizes = [r.area for r in rprops_nuclei]

_ = plt.plot(nuclear_sizes, KTR_ratios2, ".")
_ = plt.xlabel("Nuclear size")
_ = plt.ylabel("C/N ratio")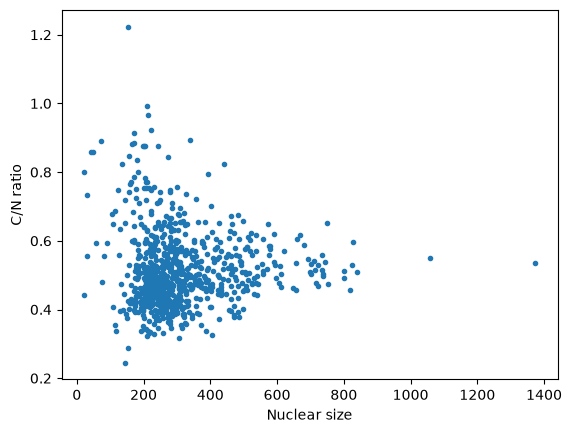
Bacterial sizes
This is the topic of the next lecture :-)