First run the main notebook
%%capture
%run './02_cellpose.ipynb'
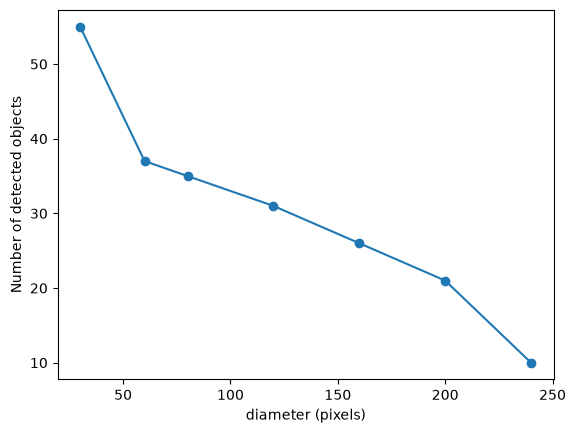
Exercise: What happens when you change the diameter?
diameters = [30, 60, 80, 120,160,200,240]
masks_per_diameter = {}

for d in diameters:
    m, _, _ = model_nuc.eval(img_nuclei, channels=[0, 0], diameter=d)
    masks_per_diameter[d] = m
    print(f"diameter {d:3d} -> {m.max():3d} objects")

_ = plt.plot(diameters, [masks_per_diameter[d].max() for d in diameters], "o-")
_ = plt.xlabel("diameter (pixels)")
_ = plt.ylabel("Number of detected objects")
diameter 30 -> 55 objects
diameter 60 -> 37 objects
diameter 80 -> 35 objects
diameter 120 -> 31 objects
diameter 160 -> 26 objects
diameter 200 -> 21 objects
diameter 240 -> 10 objects
# We can plot it like this
fig, axs = plt.subplots(1, 4, figsize=(20, 5))
for ax, d in zip(axs, diameters):
    _ = ax.imshow(img_nuclei, cmap="gray")
    _ = ax.imshow(masks_per_diameter[d], cmap=lbl_cmap, alpha=0.5)
    _ = ax.set_title(f"diameter={d}: {masks_per_diameter[d].max()} objects")
    _ = ax.axis("off")
---------------------------------------------------------------------------
NameError Traceback (most recent call last)
Cell In[5], line 5
1 # We can plot it like this
2 fig, axs = plt.subplots(1, 4, figsize=(20, 5))
3 for ax, d in zip(axs, diameters):
4 _ = ax.imshow(img_nuclei, cmap="gray")
----> 5 _ = ax.imshow(masks_per_diameter[d], cmap=lbl_cmap, alpha=0.5)
6 _ = ax.set_title(f"diameter={d}: {masks_per_diameter[d].max()} objects")
7 _ = ax.axis("off")
NameError: name 'lbl_cmap' is not defined
Too small (30, which is also the default): nuclei are cut into pieces, just like StarDist at
scale=1.Too large (120): fewer objects, because small nuclei are missed or neighbours merge.
Between 60 and 80 the result is stable.
The two parameters work in opposite directions: a larger Cellpose diameter and a smaller StarDist scale both mean the image is shrunk more before it reaches the network.
Exercise: Do StarDist and Cellpose find the same nuclei?
We redo the StarDist prediction here and put the two results next to each other.
from stardist.models import StarDist2D
from csbdeep.utils import normalize

model_sd = StarDist2D.from_pretrained("2D_versatile_fluo")
labels_sd, _ = model_sd.predict_instances(normalize(img_nuclei, 1, 99.8), scale=0.5)

print(f"StarDist: {labels_sd.max()} nuclei")
print(f"Cellpose: {masks_nuclei.max()} nuclei")
fig, axs = plt.subplots(1, 2, figsize=(12, 6))
_ = axs[0].imshow(img_nuclei, cmap="gray")
_ = axs[0].imshow(labels_sd, cmap=lbl_cmap, alpha=0.5)
_ = axs[0].set_title(f"StarDist: {labels_sd.max()} nuclei")
_ = axs[1].imshow(img_nuclei, cmap="gray")
_ = axs[1].imshow(masks_nuclei, cmap=lbl_cmap, alpha=0.5)
_ = axs[1].set_title(f"Cellpose: {masks_nuclei.max()} nuclei")
for ax in axs:
_ = ax.axis("off")The two methods find nearly the same nuclei, and the outlines differ by a few pixels. StarDist finds a few more objects than Cellpose: some of those are nuclei that Cellpose missed, and a few are small objects that are not nuclei. Those could be filtered out.
For counting foci per nucleus these shape differences do not matter much. For measuring nuclear area or intensity they can, so it is worth looking at the overlays before choosing one.