Adapted from the Spotiflow inference example.
StarDist and Cellpose gave us the outline of the nuclei. For the repair foci in the other channel we do not need an outline: they are small and round, and we only want to know where they are and how many of them are there.
Spotiflow predicts one coordinate per spot instead of a mask. When two spots are close together it can detect them as two spots.
In this notebook we detect the foci, combine them with the nuclei from the previous notebook, and count foci per nucleus in all four images.
Libraries
# Libraries for plotting, reading images and tables
import matplotlib.pyplot as plt
import tifffile as tiff
import numpy as np
import pandas as pd

# We import the spotiflow library
from spotiflow.model import Spotiflow
/var/home/maartenpaul/miniforge3/envs/2026_deep_learning/lib/python3.12/site-packages/tqdm/auto.py:21: TqdmWarning: IProgress not found. Please update jupyter and ipywidgets. See https://ipywidgets.readthedocs.io/en/stable/user_install.html
  from .autonotebook import tqdm as notebook_tqdm
Detecting lysosomes in HeLa cells
Before we go to the repair foci, we try Spotiflow on an image we already know: the HeLa cells from the Cellpose notebook. The first channel shows lysosomes, which look like bright dots in the cytoplasm.
hela = tiff.imread("data/hela_cells.tif")
img_lyso = hela[:, :, 0]

_ = plt.figure(figsize=(8, 6))
_ = plt.imshow(img_lyso, cmap="gray", vmax=np.percentile(img_lyso, 99.8))
_ = plt.axis("off")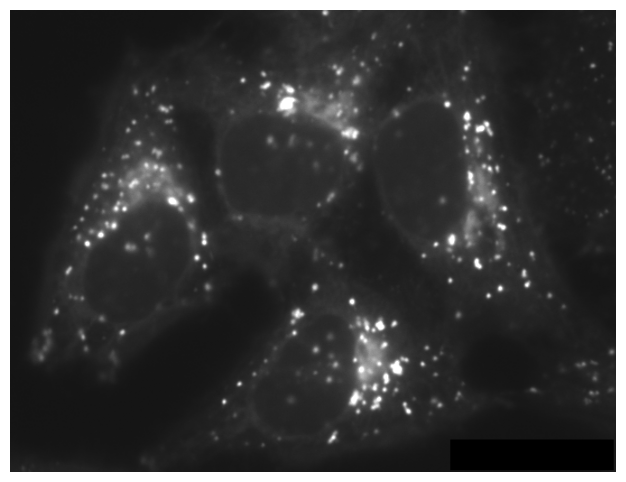
Spotiflow has several pretrained models; general is the one to start with.
predict() returns the spot coordinates as (y, x) pairs, plus some details we do not
need here.
model_spots = Spotiflow.from_pretrained("general")

points_lyso, details = model_spots.predict(img_lyso)

print(f"found {len(points_lyso)} spots")
print(points_lyso[:5])
INFO:spotiflow.model.spotiflow:Loading pretrained model: general
INFO:spotiflow.model.spotiflow:Will use device: cpu
INFO:spotiflow.model.spotiflow:Predicting with prob_thresh = [0.49999999999999994], min_distance = 1
INFO:spotiflow.model.spotiflow:Peak detection mode: fast
INFO:spotiflow.model.spotiflow:Image shape (512, 672)
INFO:spotiflow.model.spotiflow:Predicting with (1, 1) tiles
INFO:spotiflow.model.spotiflow:Normalizing...
INFO:spotiflow.model.spotiflow:Padding to shape (512, 672, 1)
INFO:spotiflow.model.spotiflow:Found 317 spots
found 317 spots
[[481.62335059 279.910313 ]
[480.03798322 261.92595756]
[477.06102252 354.63298368]
[474.25396052 297.89784578]
[474.01694293 228.01091557]]
_ = plt.figure(figsize=(8, 6))
_ = plt.imshow(img_lyso, cmap="gray", vmax=np.percentile(img_lyso, 99.8))
_ = plt.scatter(points_lyso[:, 1], points_lyso[:, 0], s=15, facecolors="none", edgecolors="orange")
_ = plt.axis("off")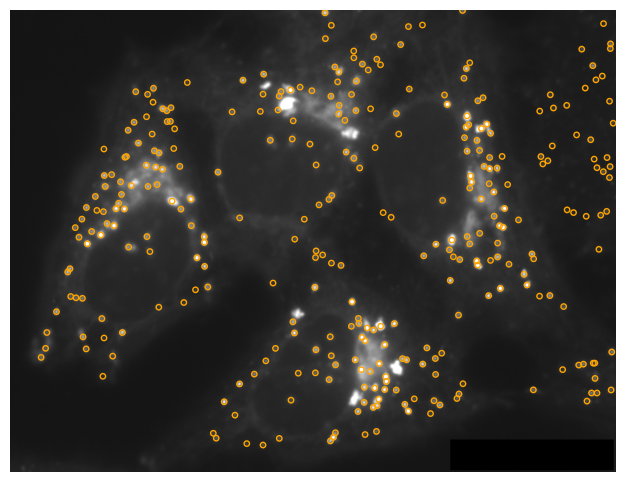
Zoom in on one cell to check the detections.
# Zoom in on a 150 x 150 pixel region
y0, x0, size = 130, 50, 150

_ = plt.figure(figsize=(7, 7))
_ = plt.imshow(img_lyso, cmap="gray", vmax=np.percentile(img_lyso, 99.8))
_ = plt.scatter(points_lyso[:, 1], points_lyso[:, 0], s=80, facecolors="none", edgecolors="orange")
_ = plt.xlim(x0, x0 + size)
_ = plt.ylim(y0 + size, y0)   # y the other way round, so the image is not flipped
_ = plt.axis("off")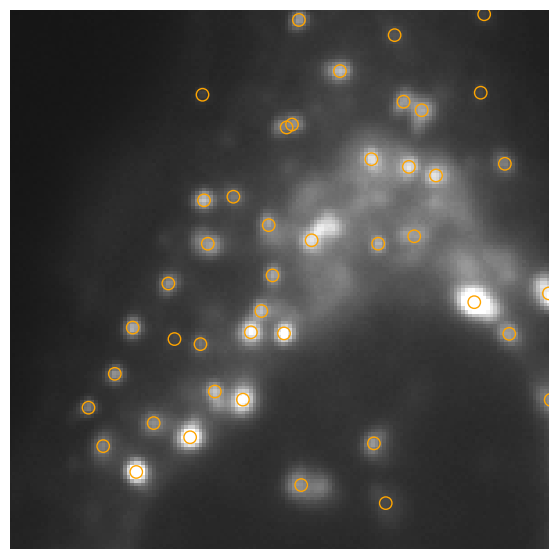
Most bright dots are found. Very large, bright blobs are sometimes skipped or get a single spot: Spotiflow looks for small, round spots of a few pixels wide.
What does Spotiflow predict?
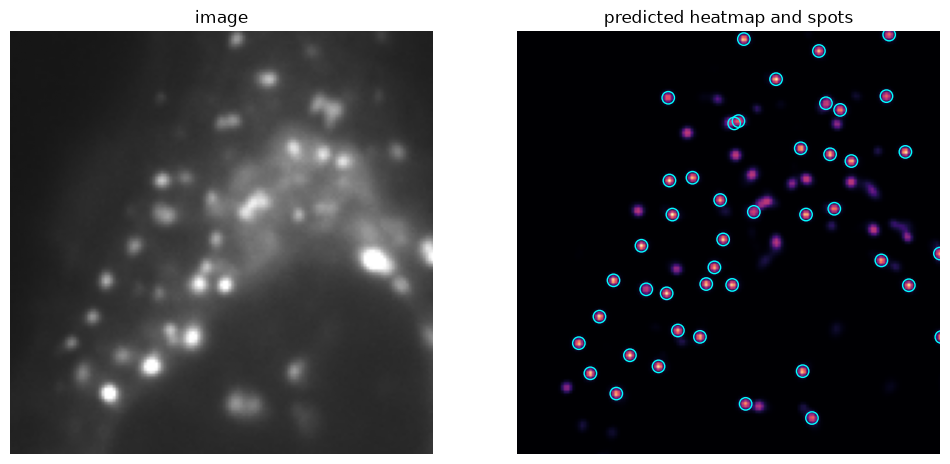
The network does not output the points directly. It predicts a heatmap: an image that is
bright where a spot is likely to be. The points are the peaks of this heatmap that are
higher than a threshold. details holds this heatmap, and in details.prob the value at
each spot, the confidence of the detection.
fig, axs = plt.subplots(1, 2, figsize=(12, 6))
_ = axs[0].imshow(img_lyso, cmap="gray", vmax=np.percentile(img_lyso, 99.8))
_ = axs[0].set_title("image")
_ = axs[1].imshow(details.heatmap, cmap="magma")
_ = axs[1].scatter(points_lyso[:, 1], points_lyso[:, 0], s=80, facecolors="none", edgecolors="cyan")
_ = axs[1].set_title("predicted heatmap and spots")
for ax in axs:
    _ = ax.set_xlim(x0, x0 + size)
    _ = ax.set_ylim(y0 + size, y0)
    _ = ax.axis("off")

print(f"lowest confidence of a detected spot: {details.prob.min():.2f}")
lowest confidence of a detected spot: 0.50
Detecting the foci
Now the foci data. We use the first channel of the irradiated image, the one with the DNA damage foci. We can reuse the model we already loaded.
img = tiff.imread("data/MAX_2h_IR_Position002.tif")
img_foci = img[0, :, :]
img_nuclei = img[1, :, :]

_ = plt.figure(figsize=(7, 7))
_ = plt.imshow(img_foci, cmap="gray", vmax=50)
_ = plt.axis("off")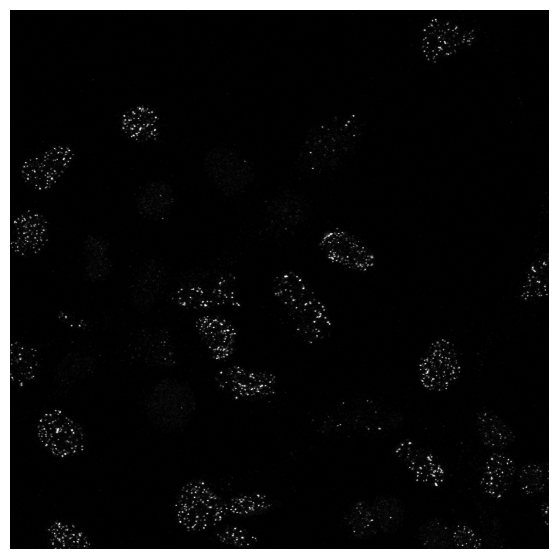
points, details = model_spots.predict(img_foci)

print(f"found {len(points)} spots")
INFO:spotiflow.model.spotiflow:Will use device: cpu
INFO:spotiflow.model.spotiflow:Predicting with prob_thresh = [0.49999999999999994], min_distance = 1
INFO:spotiflow.model.spotiflow:Peak detection mode: fast
INFO:spotiflow.model.spotiflow:Image shape (1024, 1024)
INFO:spotiflow.model.spotiflow:Predicting with (1, 1) tiles
INFO:spotiflow.model.spotiflow:Normalizing...
INFO:spotiflow.model.spotiflow:Padding to shape (1024, 1024, 1)
INFO:spotiflow.model.spotiflow:Found 1709 spots
found 1709 spots
_ = plt.figure(figsize=(8, 8))
_ = plt.imshow(img_foci, cmap="gray", vmax=50)
_ = plt.scatter(points[:, 1], points[:, 0], s=20, facecolors="none", edgecolors="orange")
_ = plt.axis("off")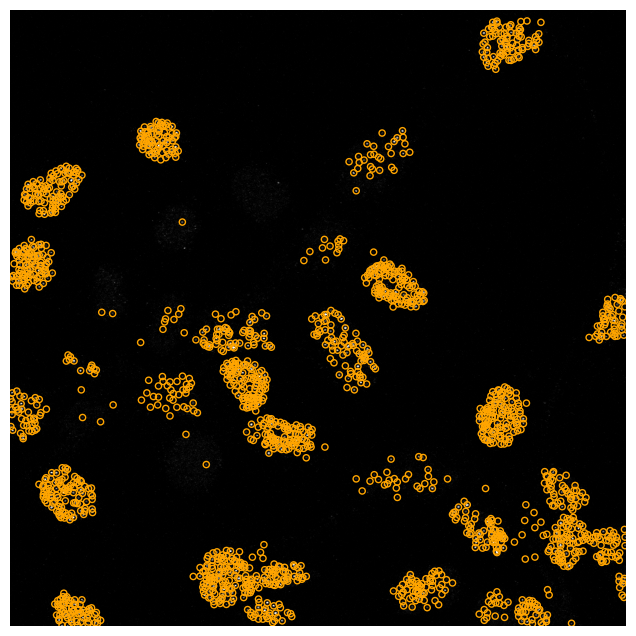
Hard to judge at this size, so let us zoom in on one nucleus.
# Zoom in on a 200 x 200 pixel region around one nucleus
y0, x0, size = 740, 20, 200

_ = plt.figure(figsize=(7, 7))
_ = plt.imshow(img_foci, cmap="gray", vmax=np.percentile(img_foci, 99.8))
_ = plt.scatter(points[:, 1], points[:, 0], s=80, facecolors="none", edgecolors="orange")
_ = plt.xlim(x0, x0 + size)
_ = plt.ylim(y0 + size, y0)   # y the other way round, so the image is not flipped
_ = plt.axis("off")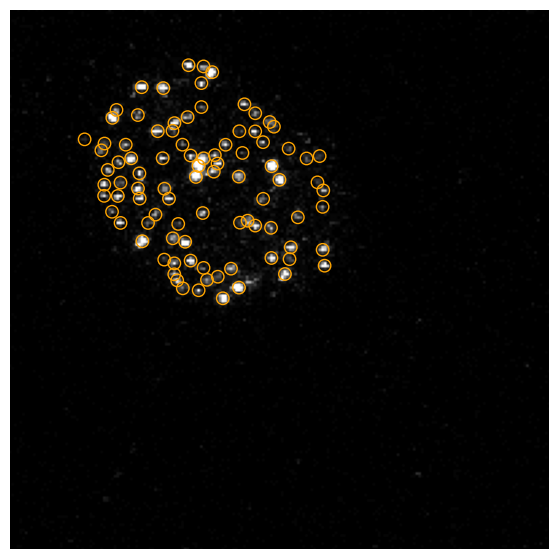
Which nucleus does each spot belong to?
We segment the nuclei exactly as in the Cellpose notebook. The label image tells us, for every pixel, which nucleus it belongs to — so we can simply look up the label at the position of each spot.
from cellpose import models

model_nuc = models.CellposeModel(model_type="nuclei")
masks, _, _ = model_nuc.eval(img_nuclei, channels=[0, 0], diameter=80)

print(f"{masks.max()} nuclei")
/var/home/maartenpaul/miniforge3/envs/2026_deep_learning/lib/python3.12/site-packages/torch/jit/_script.py:365: FutureWarning: `torch.jit.script_method` is deprecated. Please switch to `torch.compile` or `torch.export`.
warnings.warn(
/var/home/maartenpaul/miniforge3/envs/2026_deep_learning/lib/python3.12/site-packages/cellpose/dynamics.py:760: UserWarning: Sparse invariant checks are implicitly disabled. Memory errors (e.g. SEGFAULT) will occur when operating on a sparse tensor which violates the invariants, but checks incur performance overhead. To silence this warning, explicitly opt in or out. See `torch.sparse.check_sparse_tensor_invariants.__doc__` for guidance. (Triggered internally at /__w/pytorch/pytorch/aten/src/ATen/Context.cpp:848.)
coo = torch.sparse_coo_tensor(pt, torch.ones(pt.shape[1], device=pt.device, dtype=torch.int),
35 nuclei
# The coordinates are floats, so round them to whole pixels
spot_y = np.round(points[:, 0]).astype(int)
spot_x = np.round(points[:, 1]).astype(int)

# Look up the nucleus label under every spot (0 means: not in a nucleus)
spot_label = masks[spot_y, spot_x]

print(f"{np.sum(spot_label > 0)} of {len(points)} spots are inside a nucleus")
1427 of 1709 spots are inside a nucleus
# Count how often each label occurs: that is the number of foci per nucleus
counts = np.bincount(spot_label, minlength=masks.max() + 1)
foci_per_nucleus = counts[1:]   # drop the background (label 0)

print(f"foci per nucleus: {foci_per_nucleus}")
print(f"median: {np.median(foci_per_nucleus):.0f}")
foci per nucleus: [ 71 70 0 60 1 9 80 84 2 43 7 22 13 12 86 27 39 102
2 66 2 19 39 85 58 63 36 97 40 53 8 17 61 31 22]
median: 39
_ = plt.hist(foci_per_nucleus, bins=15)
_ = plt.xlabel("Foci per nucleus")
_ = plt.ylabel("Number of nuclei")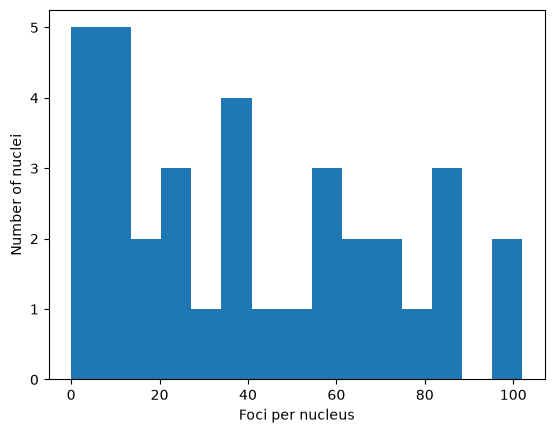
All four images
We have two irradiated and two control images. Rather than copying the code four times, we can create a function and call it for each image.
def count_foci_per_nucleus(path):
    """Return the number of foci in each nucleus of a two-channel image."""

    img = tiff.imread(path)

    # Channel 0: the foci
    points, _ = model_spots.predict(img[0, :, :], verbose=False)

    # Channel 1: the nuclei
    masks, _, _ = model_nuc.eval(img[1, :, :], channels=[0, 0], diameter=80)

    # Which nucleus is each spot in, and how many spots per nucleus?
    spot_y = np.round(points[:, 0]).astype(int)
    spot_x = np.round(points[:, 1]).astype(int)
    counts = np.bincount(masks[spot_y, spot_x], minlength=masks.max() + 1)

    return counts[1:]
What this function does: it detects the spots and the nuclei. Then it reads for every spot which nucleus it belongs to, by checking the value of the label image at that location.
Finally it returns only the counts of the spots inside the nuclei: counts[1:] drops label 0, the background.
files = [
    "data/MAX_2h_control_Position001.tif",
    "data/MAX_2h_control_Position002.tif",
    "data/MAX_2h_IR_Position001.tif",
    "data/MAX_2h_IR_Position002.tif",
]

results = []
for path in files:
    condition = "IR" if "IR" in path else "control"
    for n_foci in count_foci_per_nucleus(path):
        results.append({"file": path, "condition": condition, "foci": n_foci})

results = pd.DataFrame(results)
print(f"{len(results)} nuclei in total")
results.head()
170 nuclei in total
results.groupby("condition")["foci"].agg(["count", "mean", "median"])# Put the control first, then the irradiated cells
conditions = ["control", "IR"]
data = [results.loc[results["condition"] == c, "foci"] for c in conditions]
_ = plt.boxplot(data, tick_labels=conditions)
_ = plt.ylabel("Foci per nucleus")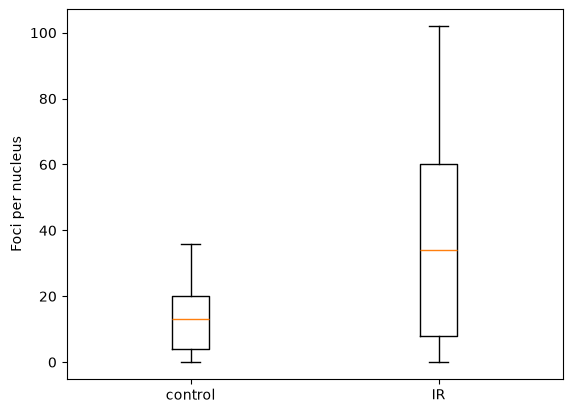
The irradiated cells have many more foci per nucleus than the control cells. That is what we expect: irradiation causes DNA breaks, and the foci are repair proteins gathering at those breaks.
Exercise: How many spots does Spotiflow find outside the nuclei?
We saw that some spots are not inside any nucleus.
How many are there, and where are they in the image?
Plot them on top of the image and have a look. Are they real foci, and would it be a problem to leave them out?
Exercise: What does the detection threshold change?
predict() takes a prob_thresh argument: the confidence a spot needs before it is
kept. The default is the value the model was tuned with (0.5 for the general model).
Run the prediction on img_foci with prob_thresh set to 0.3, 0.5 and 0.7, and plot the
number of detected spots. Look at the zoomed-in region from earlier for each setting: which spots
appear and disappear?
Bonus exercise: Nuclei on the edge of the image
Some nuclei touch the edge of the image, so we only see part of them. Those nuclei get too few foci and pull down the counts.
Change count_foci_per_nucleus() so it leaves out the nuclei that touch the border, and
run the loop over the four images again. sk.segmentation.clear_border(masks) sets
those nuclei to 0 (you need import skimage as sk first).
Also after removing the labels on the border we can use segmentation.relabel_sequential() to relabel the the labels without gaps.
How many nuclei are left?
Does the mean number of foci per nucleus change?
Wrapping up
We used three pretrained models without training anything ourselves:
StarDist — nuclei as star-convex polygons
Cellpose — cells and nuclei from predicted flows
Spotiflow — spots as coordinates